In my last article i was created a bar chart with using javascript.I simply created using html and css.
This article we going to see how to create a graph with using d3.js
First,In java script prepare the data sets
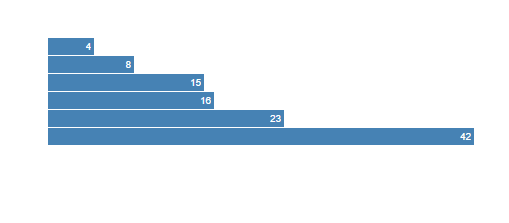
var data = [4, 8, 15, 16, 23, 42];
Based on the above number of data's we create a separate div for each.
So first create a styles for bar chart
<style>

.chart div {
  font: 10px sans-serif;
  background-color: steelblue;
  text-align: right;
  padding: 3px;
  margin: 1px;
  color: white;
}

</style>
Also,Create a placeholder for chart
<div class="chart"></div>
Then using Linear scales method in d3 we can map a continuous input domain to a continuous output range.
D3’s scales specify a mapping from data space (domain) to display space (range)
var x = d3.scale.linear()
    .domain([0, d3.max(data)])
    .range([0, 420]);
Although x here looks like an object, it is also a function that returns the scaled display value in the range for a given data value in the domain. For example, an input value of 4 returns 40, and an input value of 16 returns 160.
Then using d3 functions select and selectAll to select the placeholder part and plot the data's
d3.select(".chart")
  .selectAll("div")
    .data(data)
  .enter().append("div")
    .style("width", function(d) { return x(d) + "px"; })
    .text(function(d) { return d; });
From the above code select is used to select the container (In this program .chart is the container)
selectAll method is used to select all the elements.Here it will select all the div.In d3 using data we will pass the datas.So in above programs based on the datas it append the number div using append method.
Using style method it will set the styles.In above program width will set based on the datas and text method used to set the text.
Full Code
<!DOCTYPE html>
<html>
<head>
<meta charset="utf-8">
<style>

.chart div {
  font: 10px sans-serif;
  background-color: steelblue;
  text-align: right;
  padding: 3px;
  margin: 1px;
  color: white;
}

</style>
</head>
<body>
<div class="chart"></div>
<script src="http://d3js.org/d3.v3.min.js"></script>
<script>

var data = [4, 8, 15, 16, 23, 42];

var x = d3.scale.linear()
    .domain([0, d3.max(data)])
    .range([0, 420]);

d3.select(".chart")
  .selectAll("div")
    .data(data)
  .enter().append("div")
    .style("width", function(d) { return x(d) + "px"; })
    .text(function(d) { return d; });

</script>
</body>
</html>
Output for the above code: